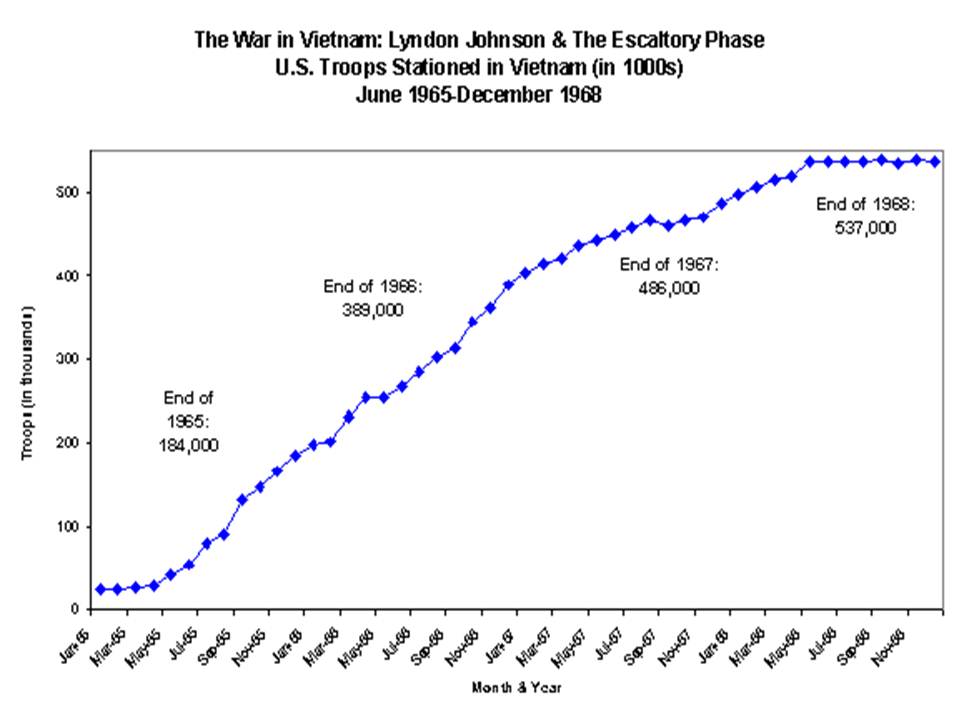
The chart above represents the number of US troops sent to Vietnam from 1965-1968
Also above is a chart representing the public approval for Johnson and other Vietnam war related affairs.
Right below is a link of all the US casualties organized by age groups, service branch, casualty type, race, cause of death, religion, sex, and state.
Age Groups
Service Branch
Service Component
Casualty Type
Race
Cause of Death
Religion
Sex
State
Age Groups
Service Branch
Service Component
Casualty Type
Race
Cause of Death
Religion
Sex
State

Major Cities and visual map of Vietnam with surrounding countries is pictured above.
